
Pandas用法(一)
本文档记录Pandas的各种使用方法,方便自己后续查阅。
数据类型
| 数据结构 | 维度 | 说明 |
|---|---|---|
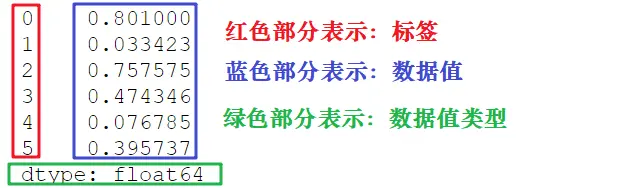
| Series | 1 | 该结构能够存储各种数据类型,比如字符数、整数、浮点数、Python 对象等,Series 用 name 和 index 属性来描述数据值。Series 是一维数据结构,因此其维数不可以改变。 |
| DataFrame | 2 | DataFrame 是一种二维表格型数据的结构,既有行索引,也有列索引。行索引是 index,列索引是 columns。在创建该结构时,可以指定相应的索引值。 |
Series
创建Series对象
1 | import pandas as pd |
| 参数名称 | 描述 |
|---|---|
| data | 输入的数据,可以是列表、常量、ndarray 数组等。 |
| index | 索引值必须是惟一的,如果没有传递索引,则默认为 np.arrange(n)。 |
| dtype | dtype表示数据类型,如果没有提供,则会自动判断得出。 |
| copy | 表示对 data 进行拷贝,默认为 False。 |
dict 创建 Series
1 | import pandas as pd |
输出结果 #### 访问Series 1
2
3
4a 0.0
b 1.0
c 2.0
dtype: float64 ### DataFrame
1
2
3
4
5
6
7import pandas as pd
s = pd.Series([1,2,3,4,5],index = ['a','b','c','d','e'])
print(s[0]) #位置下标
print(s['a']) #标签下标
print(s[:3]) #支持切片
s.head()#默认显示前5行
s.tail()#默认显示后5行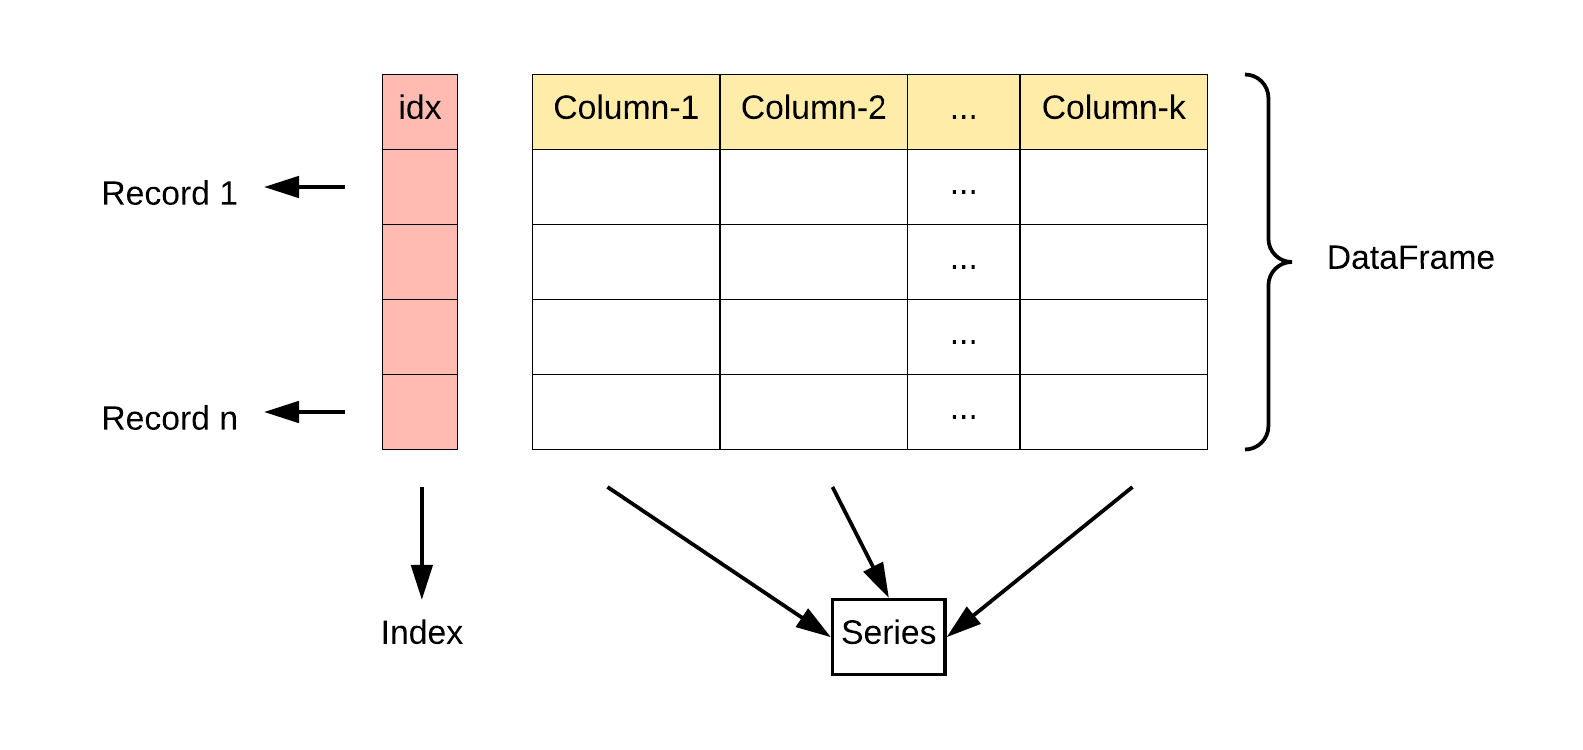
创建Dataframe
1 | import pandas as pd |
| 参数名称 | 说明 |
|---|---|
| data | 输入的数据,可以是 ndarray,series,list,dict,标量以及一个 DataFrame。 |
| index | 行标签,如果没有传递 index 值,则默认行标签是 np.arange(n),n 代表 data 的元素个数。 |
| columns | 列标签,如果没有传递 columns 值,则默认列标签是 np.arange(n)。 |
| dtype | dtype表示每一列的数据类型。 |
| copy | 默认为 False,表示复制数据 data。 |
- 各种创建方法
1
2
3
4
5
6
7
8
9
10
11
12
13
14
15
16
17
18
19
20
21
22
23
24data = [1,2,3,4,5]
df = pd.DataFrame(data)]
data = [['Alex',10],['Bob',12],['Clarke',13]]
df = pd.DataFrame(data,columns=['Name','Age'])
data = [['Alex',10],['Bob',12],['Clarke',13]]
df = pd.DataFrame(data,columns=['Name','Age'],dtype=float)
data = {'Name':['Tom', 'Jack', 'Steve', 'Ricky'],'Age':[28,34,29,42]}
df = pd.DataFrame(data)
data = {'Name':['Tom', 'Jack', 'Steve', 'Ricky'],'Age':[28,34,29,42]}
df = pd.DataFrame(data, index=['rank1','rank2','rank3','rank4'])
data = [{'a': 1, 'b': 2},{'a': 5, 'b': 10, 'c': 20}]
df = pd.DataFrame(data)
# a b c
# 0 1 2 NaN
# 1 5 10 20.0
d = {'one' : pd.Series([1, 2, 3], index=['a', 'b', 'c']),
'two' : pd.Series([1, 2, 3, 4], index=['a', 'b', 'c', 'd'])}
df = pd.DataFrame(d) #利用Series创建
列索引操作Dataframe(按列来操作)
1 | mport pandas as pd |
行索引操作DataFrame(对行进行操作)
1 | import pandas as pd |
其余属性和方法
| 名称 | 属性&方法描述 |
|---|---|
| T | 行和列转置。 |
| axes | 返回一个仅以行轴标签和列轴标签为成员的列表。 |
| dtypes | 返回每列数据的数据类型。 |
| empty | DataFrame中没有数据或者任意坐标轴的长度为0,则返回True。 |
| ndim | 轴的数量,也指数组的维数。 |
| shape | 返回一个元组,表示了 DataFrame 维度。 |
| size | DataFrame中的元素数量。 |
| values | 使用 numpy 数组表示 DataFrame 中的元素值。 |
| head() | 返回前 n 行数据。 |
| tail() | 返回后 n 行数据。 |
| shift() | 将行或列移动指定的步幅长度 |
- 要移动某一行/列用shift
1
DataFrame.shift(periods=1, freq=None, axis=0)
| 参数名称 | 说明 |
|---|---|
| peroids | 类型为int,表示移动的幅度,可以是正数,也可以是负数,默认值为1。 |
| freq | 日期偏移量,默认值为None,适用于时间序。取值为符合时间规则的字符串。 |
| axis | 如果是 0 或者 "index" 表示上下移动,如果是 1 或者 "columns" 则会左右移动。 |
| fill_value | 该参数用来填充缺失值。 |
自定义函数
- 操作整个 DataFrame 的函数:pipe()
- 操作行或者列的函数:apply()
- 操作单一元素的函数:applymap() ### 操作整个数据表 ### 操作行或列
1
2
3
4
5
6
7
8
9
10
11
12
13
14
15
16
17
18
19
20
21
22import pandas as pd
import numpy as np
#自定义函数
def adder(ele1,ele2):
return ele1+ele2
#操作DataFrame
df = pd.DataFrame(np.random.randn(4,3),columns=['c1','c2','c3'])
#相加前
print(df)
#相加后
print(df.pipe(adder,3))
c1 c2 c3
0 1.989075 0.932426 -0.523568
1 -1.736317 0.703575 -0.819940
2 0.657279 -0.872929 0.040841
3 0.441424 1.170723 -0.629618
c1 c2 c3
0 4.989075 3.932426 2.476432
1 1.263683 3.703575 2.180060
2 3.657279 2.127071 3.040841
3 3.441424 4.170723 2.370382### 操作单一元素1
2
3
4
5
6
7
8
9
10
11
12
13
14
15
16
17
18
19
20
21
22
23
24
25
26import pandas as pd
import numpy as np
df = pd.DataFrame(np.random.randn(5,3),columns=['col1','col2','col3'])
df.apply(np.mean)
#默认按列操作,计算每一列均值
print (df.apply(np.mean))
#传递轴参 axis=1, 表示逐行进行操作
print (df.apply(np.mean,axis=1))
print(df.apply(lambda x: x.max() - x.min()))
col1 0.277214
col2 0.716651
col3 -0.250487
dtype: float64
0 -0.244641
1 -0.209242
2 -0.323908
3 -0.373431
4 0.285771
dtype: float64
col1 3.538252
col2 2.904771
col3 2.650892
dtype: float641
2
3
4
5
6
7
8
9
10
11
12
13
14
15
16
17
18import pandas as pd
import numpy as np
#自定义函数
df = pd.DataFrame(np.random.randn(5,3),columns=['col1','col2','col3'])
print(df.applymap(lambda x:x*10))
print(df.apply(np.mean))
col1 col2 col3
0 -1.055926 7.952690 15.225932
1 9.362457 -12.230732 7.663450
2 2.910049 -2.782934 2.073905
3 -12.008132 -1.444989 5.988144
4 2.877850 6.563894 8.192513
#求均值:
col1 0.041726
col2 -0.038841
col3 0.782879
dtype: float64
All articles in this blog are licensed under CC BY-NC-SA 4.0 unless stating additionally.
 wechat
 alipay
Related Articles


Comment
